Software
NovaISM NEW
Image Scanning Microscopy Analysis Software
- Seamless integration with Luminosa microscope, optimized for the PDA-23 SPAD array detector
- Higher resolution than confocal imaging with pixel-reassignment and one-click deconvolution
- State-of-the-art computational sectioning in combination with lifetime species separation, improving contrast and resolution
- Comprehensive data export options: Supports multiple formats, including OME-TIFF and scalable vector graphics
 Contact us
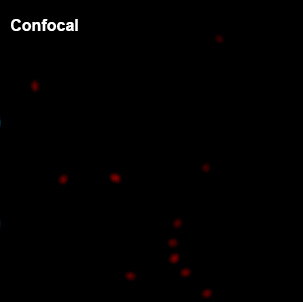
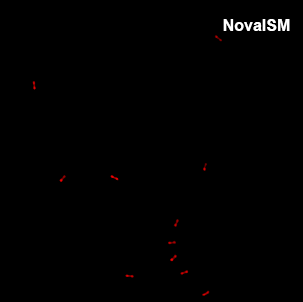
NovaISM is a powerful Fluorescence Lifetime Imaging Microscopy (FLIM) analysis software specifically optimized for the PDA-23 SPAD array detector. It combines cutting-edge pixel reassignment, computational sectioning, and deconvolution techniques to achieve up to 1.7 times higher resolution compared to conventional confocal microscopy images.
By effectively rejecting out-of-focus light, NovaISM enhances the signal-to-noise ratio and significantly improves the lifetime contrast of FLIM images. These advantages enable faster image acquisition or gentler imaging of live samples, making it an essential tool for advanced image scanning microscopy.
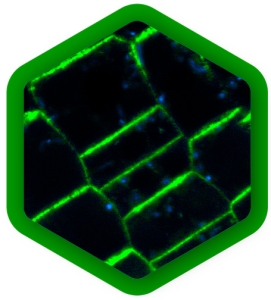
Image: GattaQuant 160 nm rulers (GATTA-SIM series)
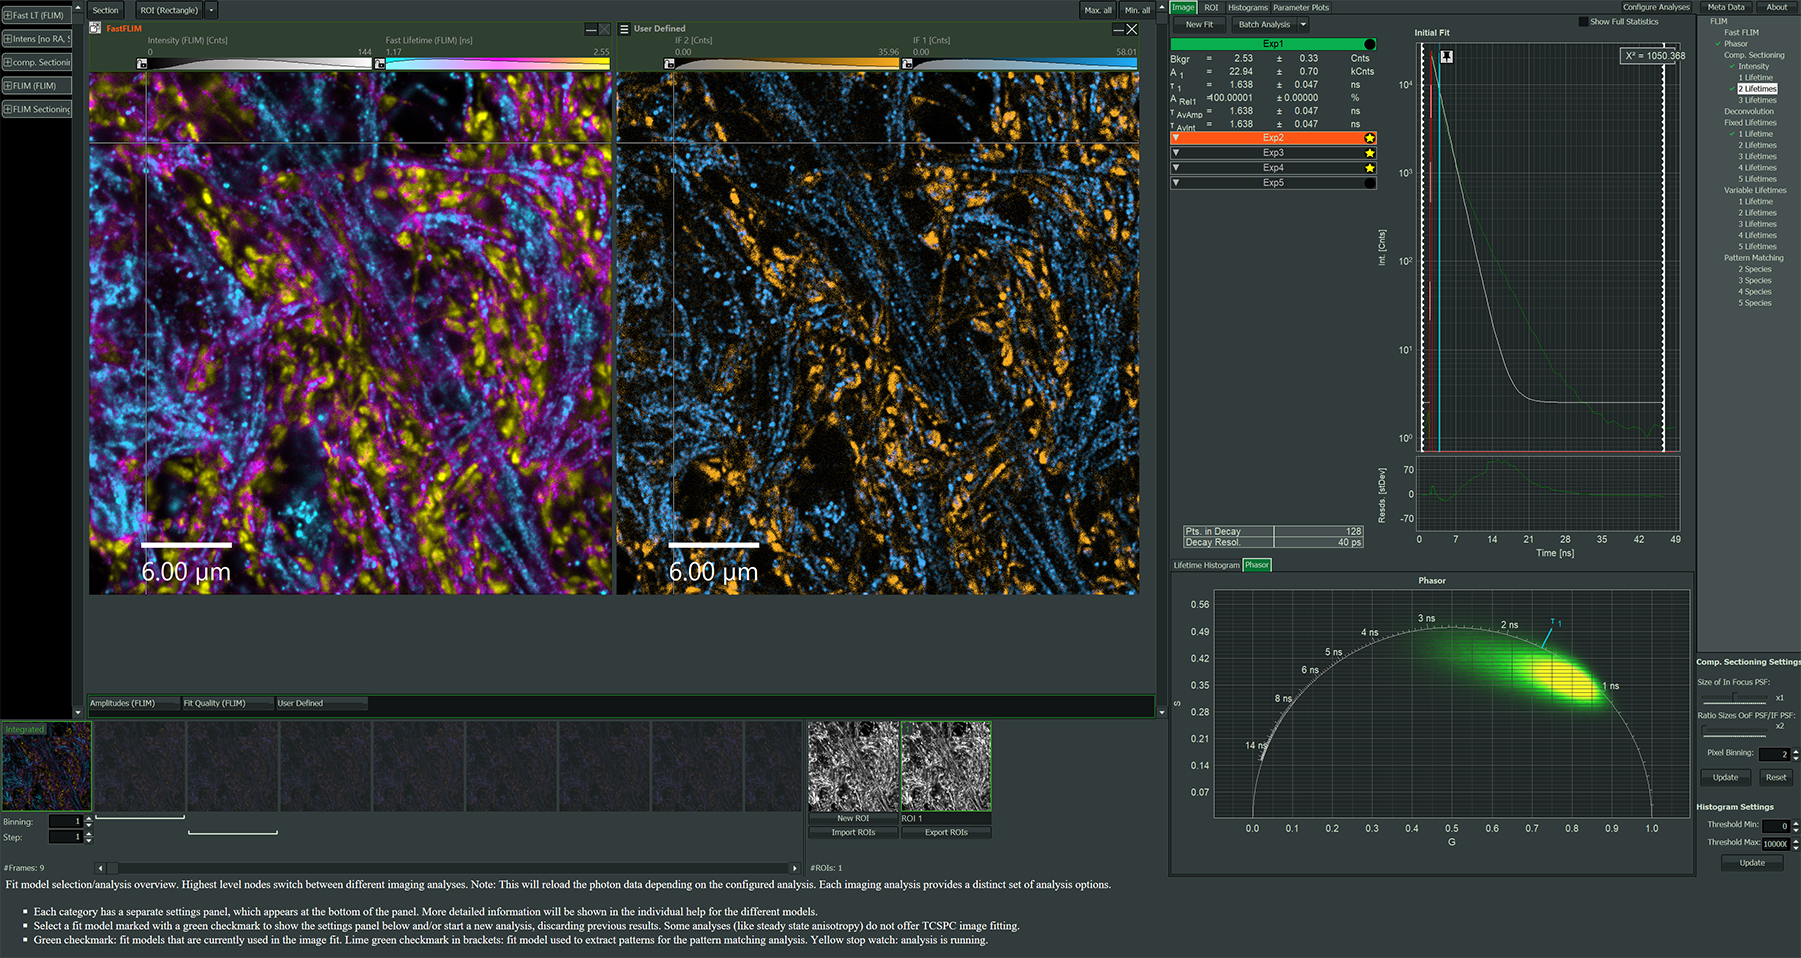
Advanced ISM-FLIM analysis: High-resolution imaging with deconvolution
Quality and precision you can trust
- Computational sectioning algorithm in combination with lifetime-species separation
- Transparency over the parameters used for deconvolution and computational sectioning
Save time and simply focus on your samples
- One-Click Deconvolution
- Minimal user interaction required
- Efficient analysis of series measurements, including batch analysis and parameter plots of multiple-ROIs
Advanced flexibility
- Raw data include individual time tags of each of the 23 pixels of the PDA-23 SPAD array
- Many data export options for graphs and images (BMP, PNG, OME-TIFFf, Scalable Vector Graphics)
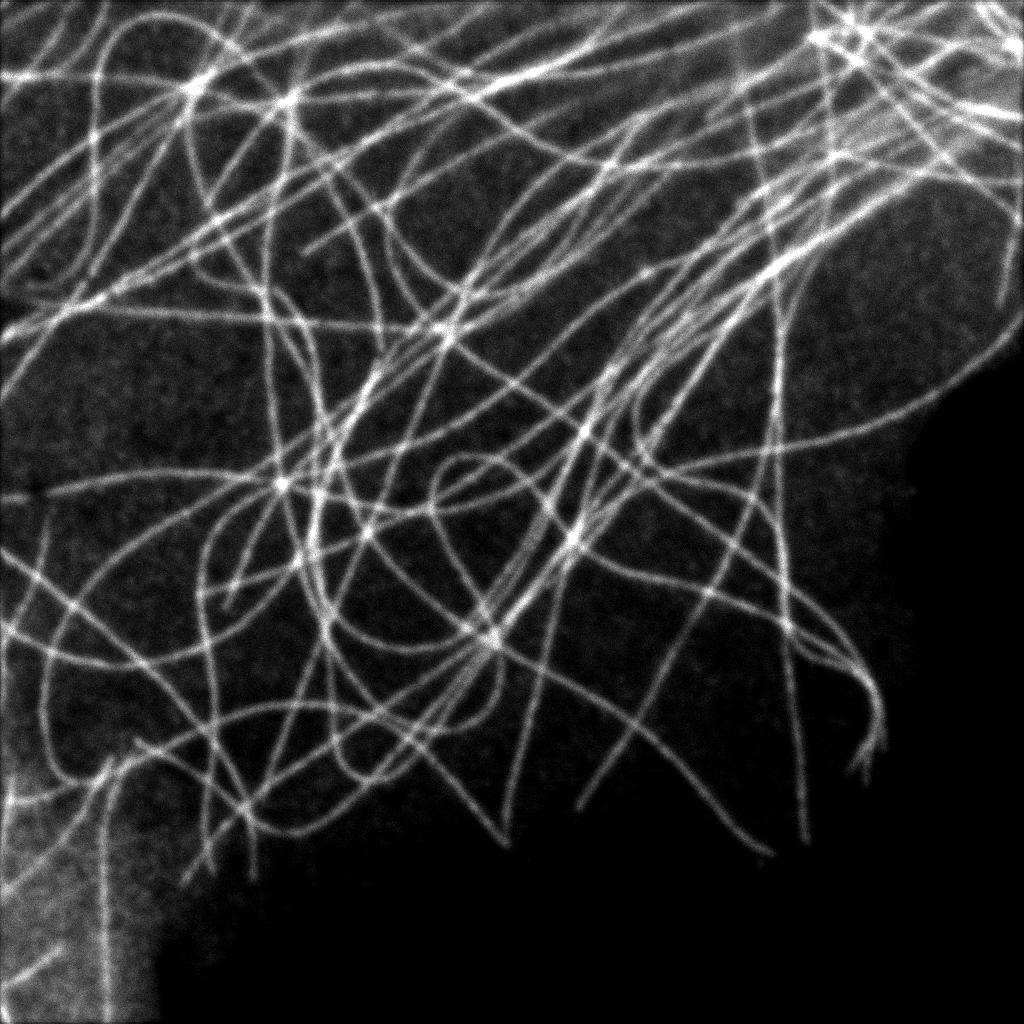
Images with more resolution and higher contrast
Follow the effects of ISM, computational sectioning, and deconvolution step-by-step
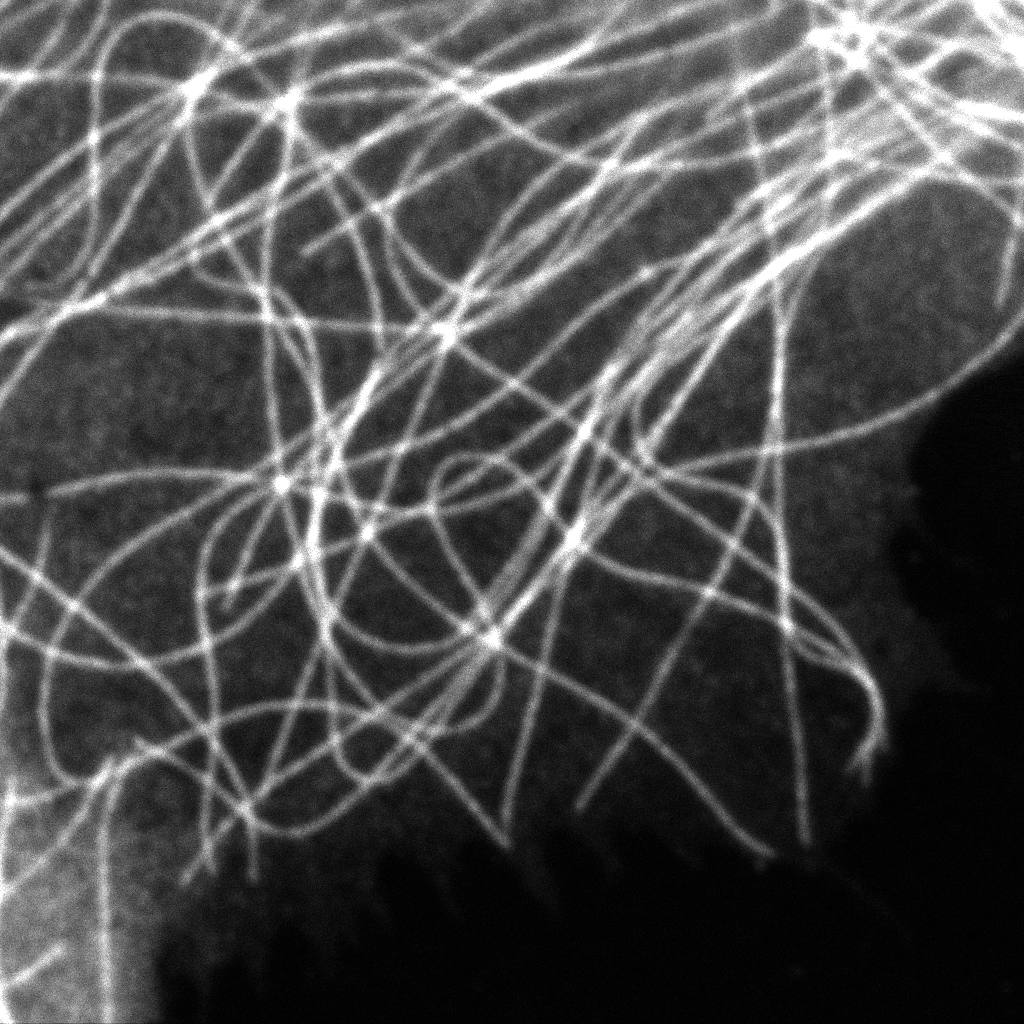
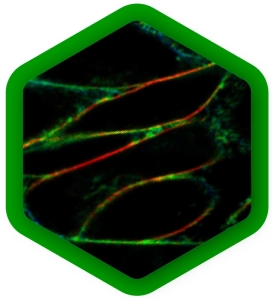
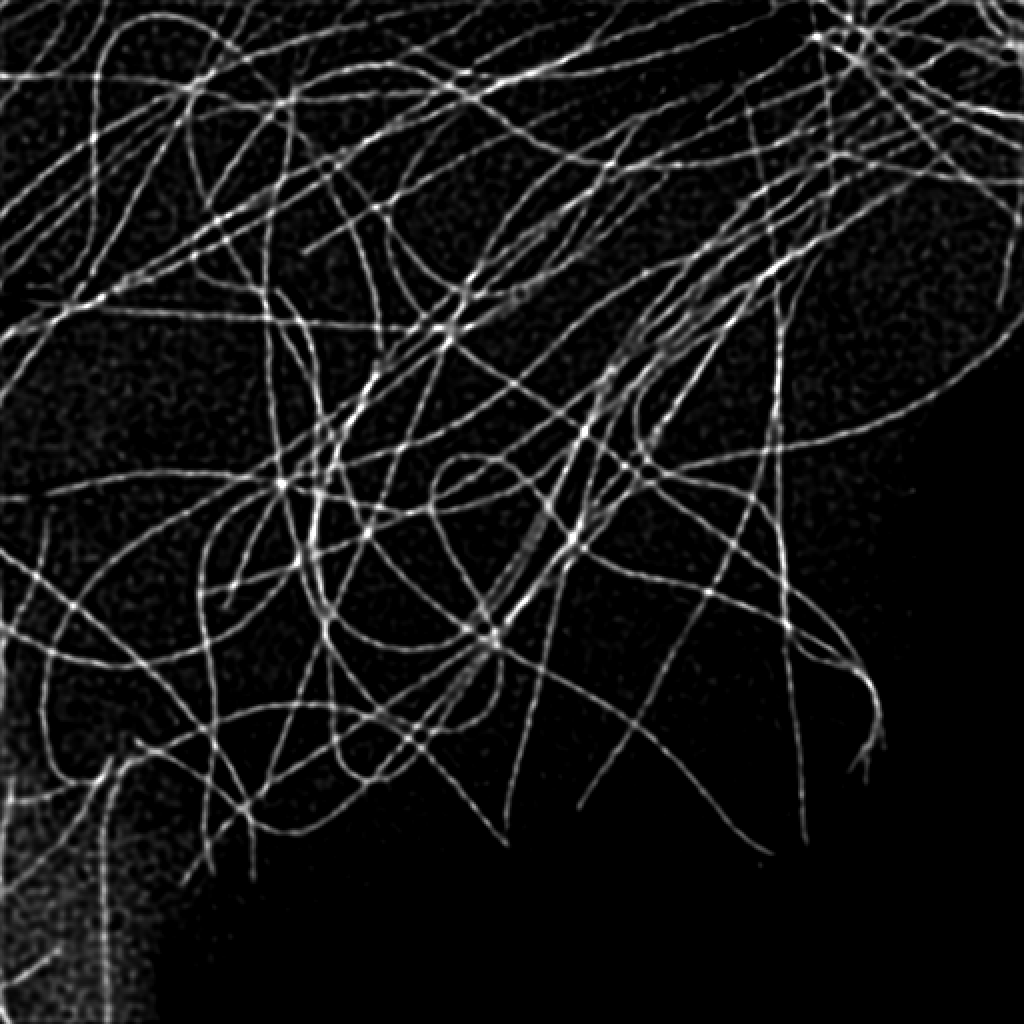
Intensity image from summing up all 23 pixels of PDA-23 Detector. This corresponds quite well to the usual confocal imaging.
U2OS Cells by GattaQuant, Tubulin staining with Alexa488.
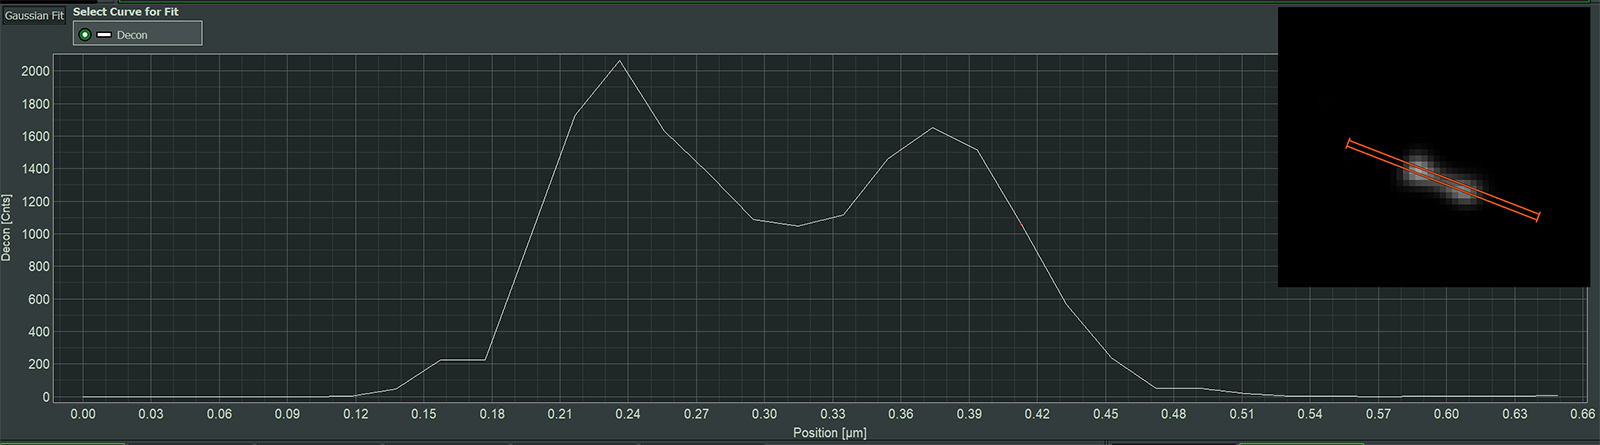
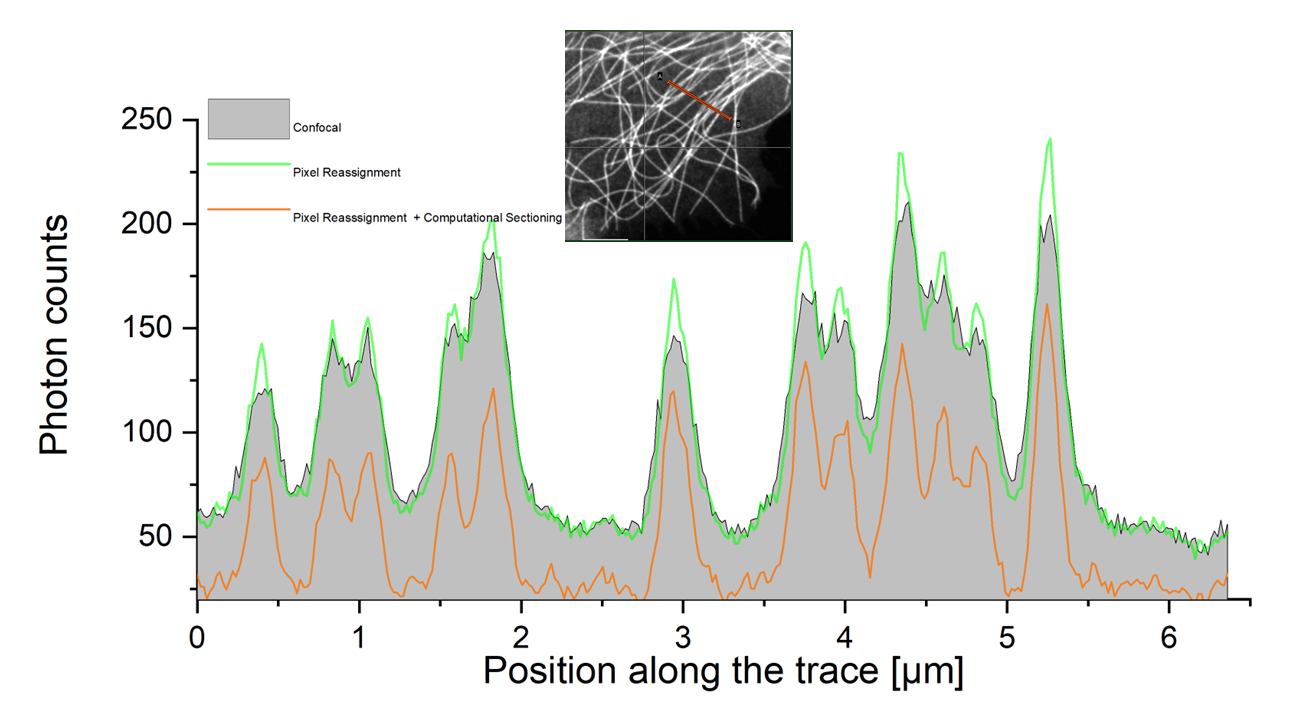
Enhanced analysis: Step-by-step improvement in intensity traces
Intensity trace along a section extending over a number of tubulin strands. The improvement achieved in each analysis step are shown.
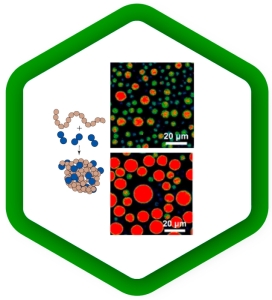
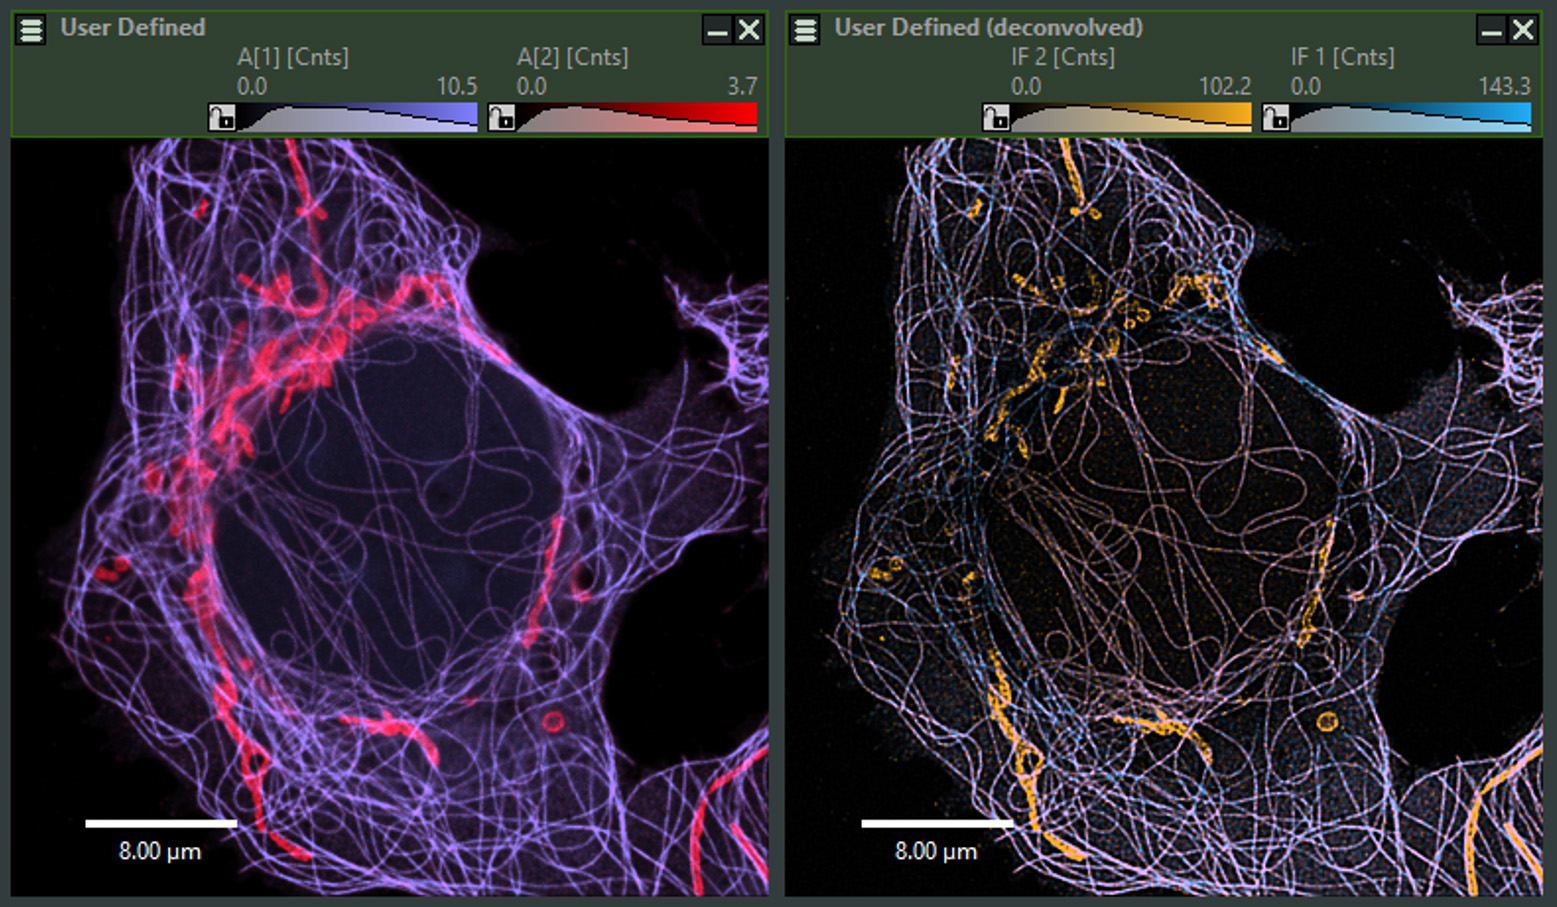
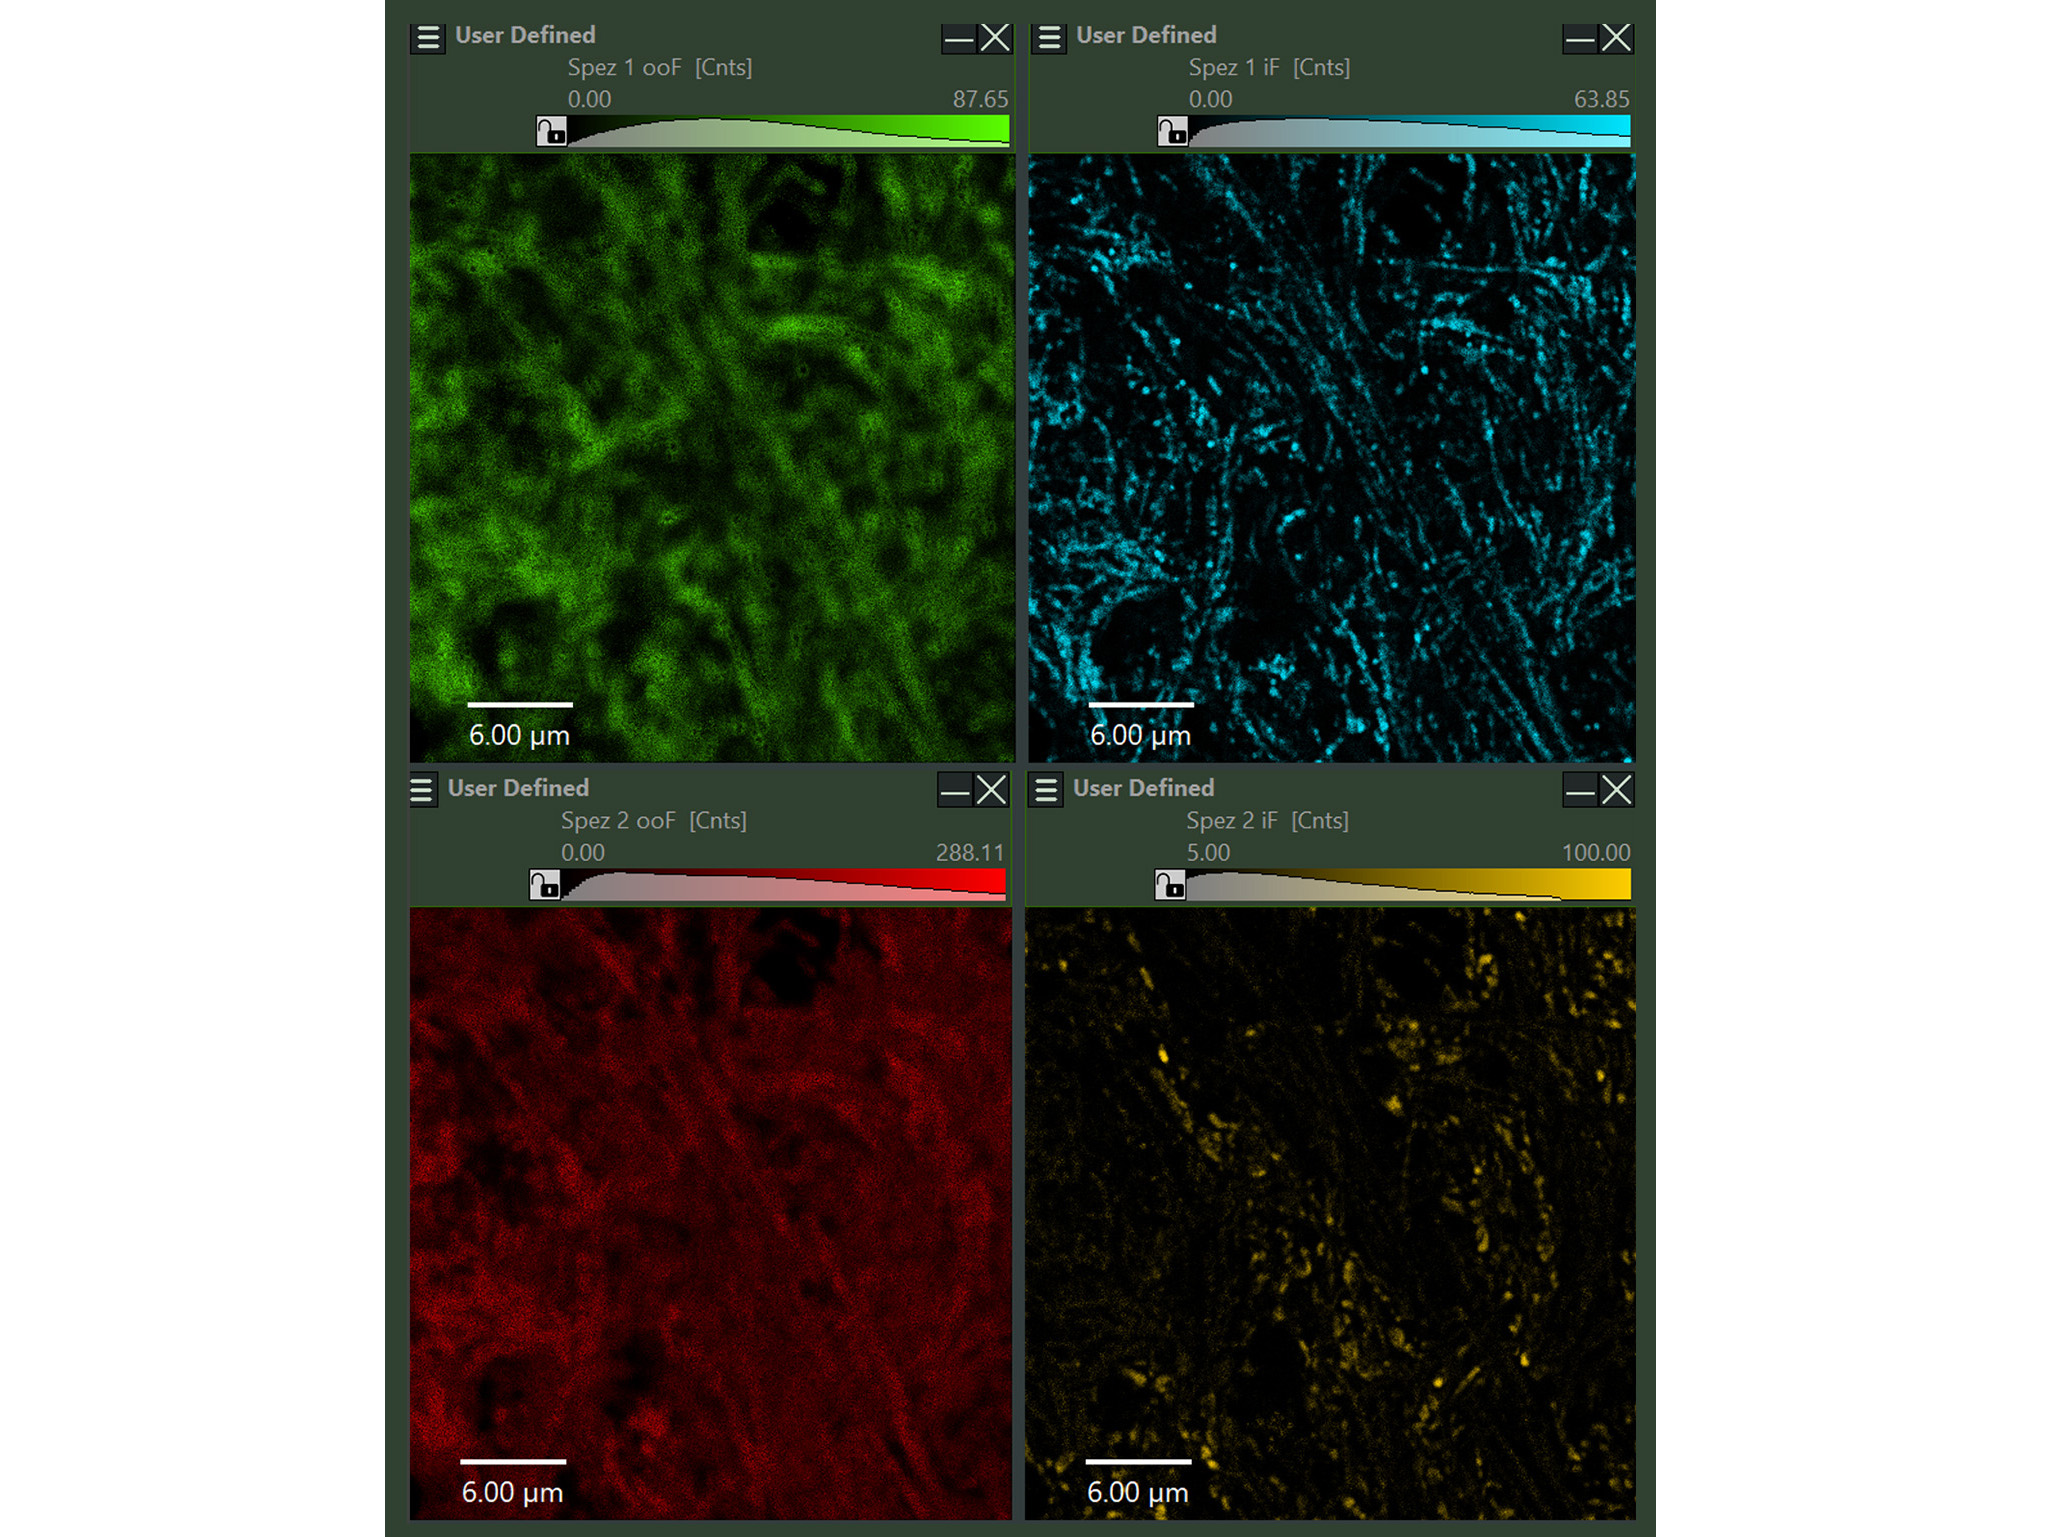
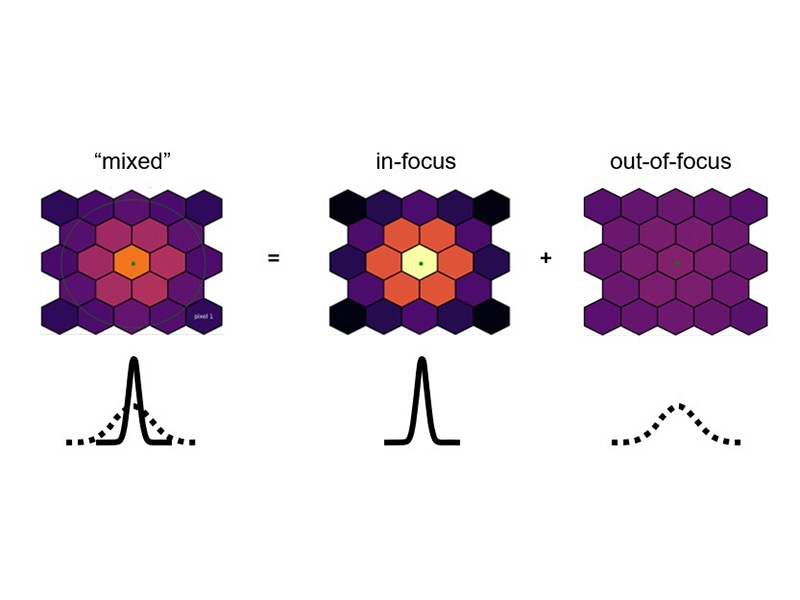
Advanced computational sectioning: Remove out-of-focus light and separate lifetime species
The computational sectioning is based on an unmixing of the intensity distribution over the PDA-23 detector array. This process allows for rejection of light coming from out-of-focus planes which in thicker samples can be problematic as it limits the contrast, produces artifacts in the deconvolution process and interferes in the lifetime –species determination. With computational sectioning offered by NovaISM all these problems are resolved.
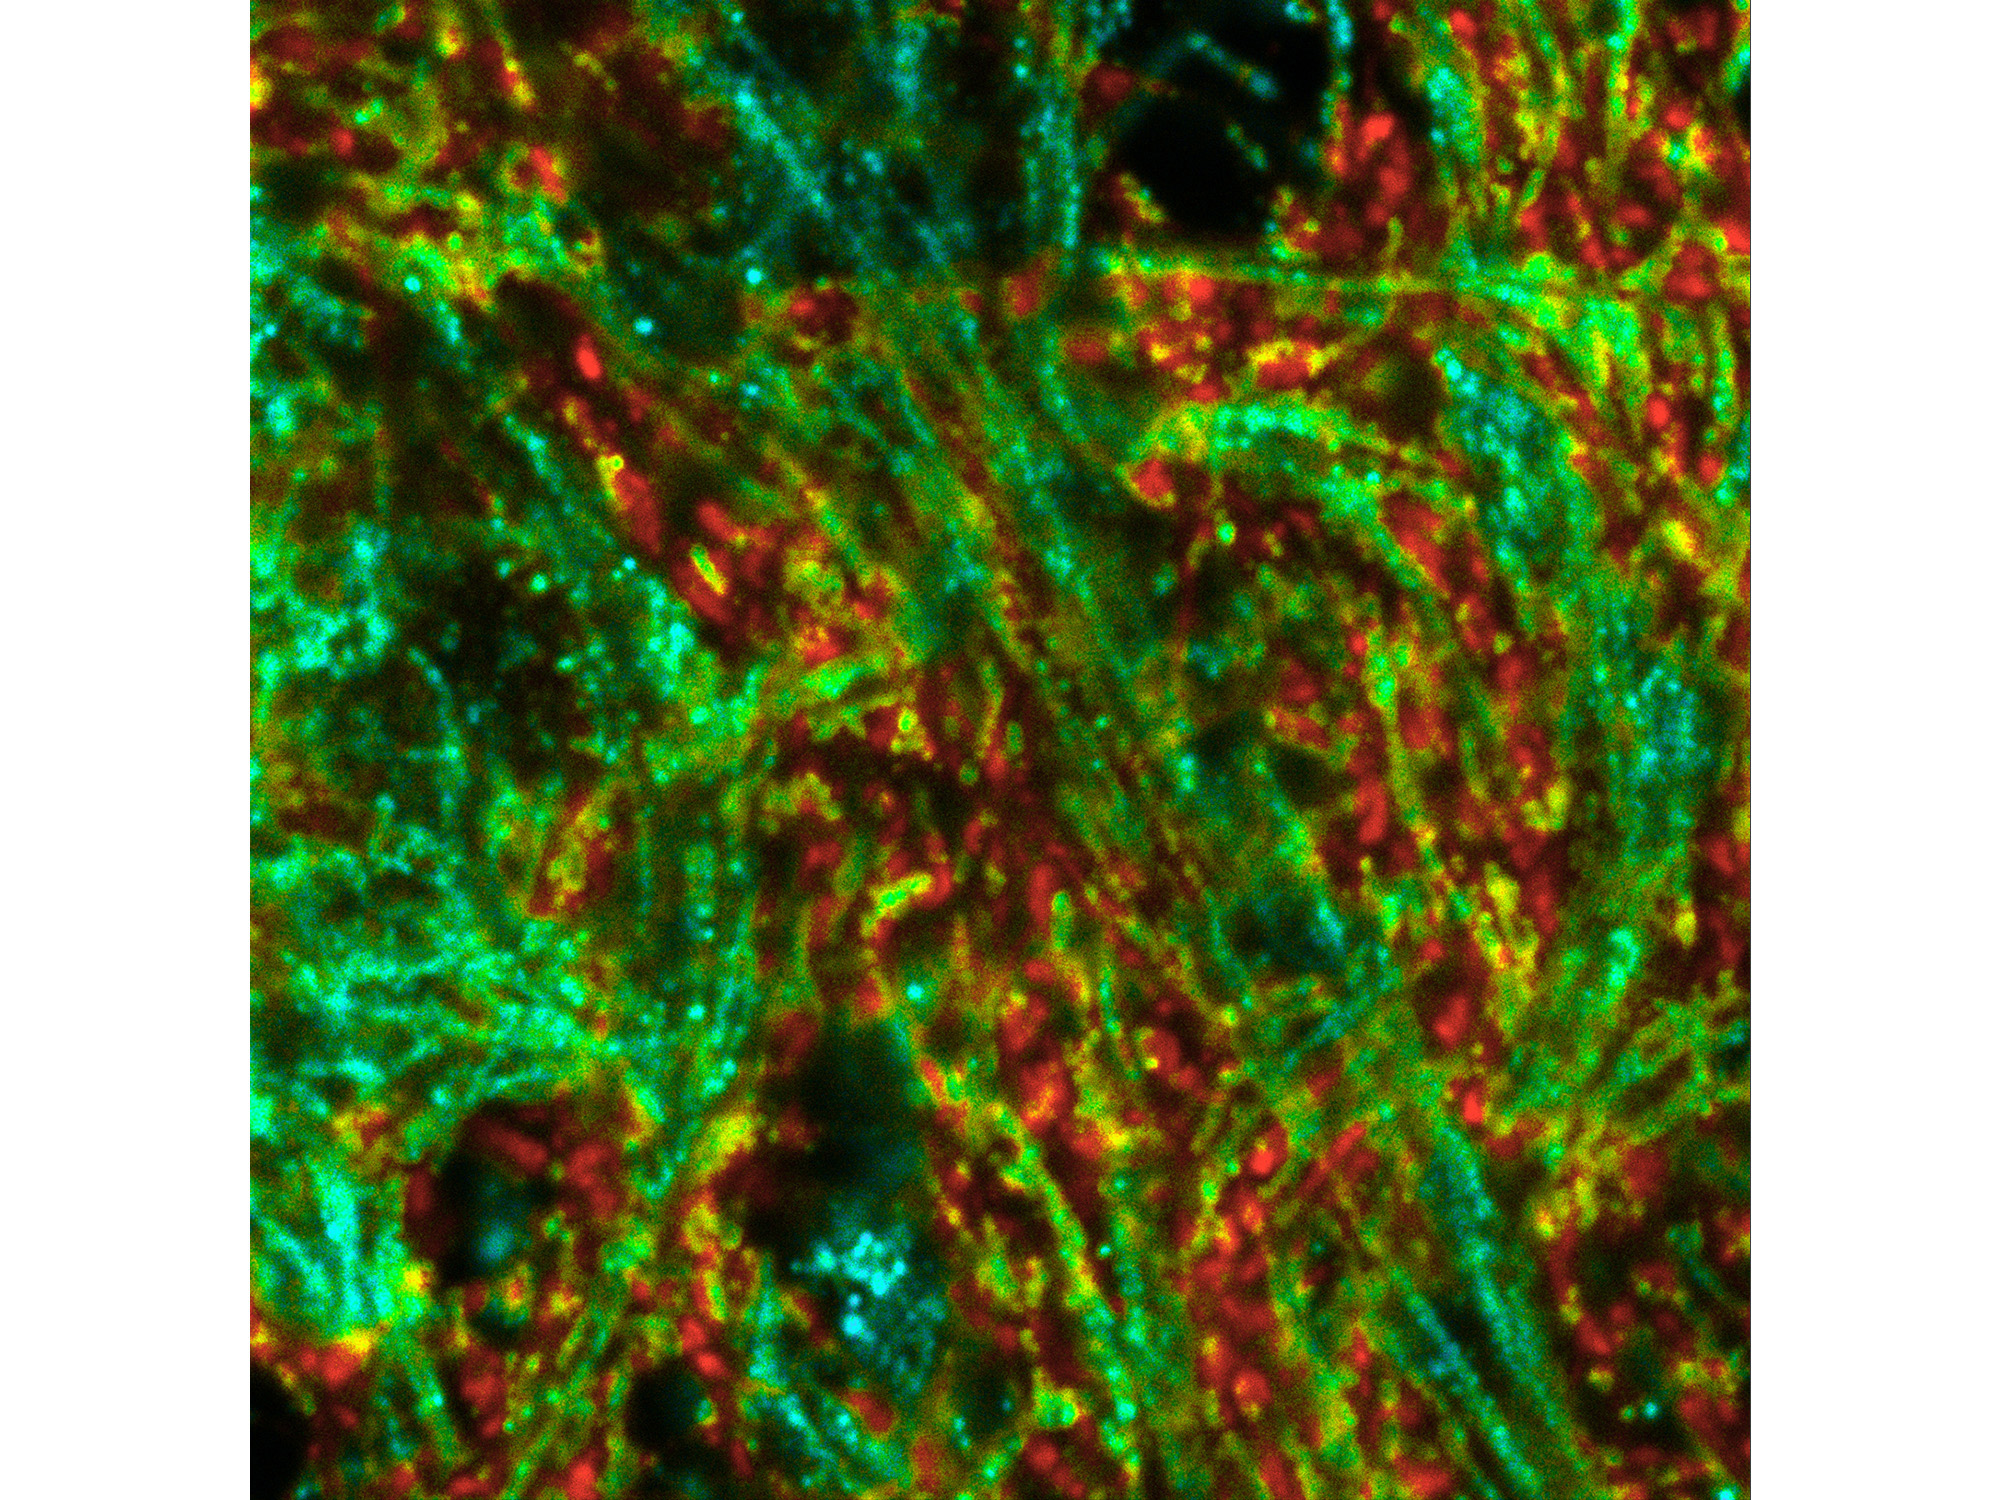
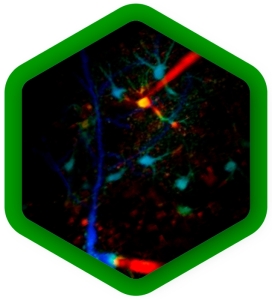
Intensity-weighted ISM-FLIM image. Colorscale indicates the fast lifetime contrast ranging from blue (shorter lifetimes) to red (longer lifetimes) sample: neuronal hippocampal culture, labeling of mitochondrial marker TOM20 with Cy2 (lifetime 1.3 ns) and synamptic vesicles marker SYPT1 with OregonGreen (lifetime 3.5 ns). Samples prepared by Dr. Eman Abbas, Rizzoli lab, UMG Goettingen.
Request a demo of NovaISM
Contact us to make an appointment >