-
Applications
-
Life Science
- rapidFLIMHiRes (Fluorescence Lifetime Imaging) New
- Fluorescence Lifetime Imaging (FLIM)
- Phosphorescence Lifetime Imaging (PLIM)
- Foerster Resonance Energy Transfer (FRET)
- Pulsed Interleaved Excitation (PIE)
- scanning Fluorescence Correlation Spectroscopy (sFCS) New
- Fluorescence Correlation Spectroscopy (FCS)
- Fluorescence Lifetime Correlation Spectroscopy (FLCS)
- Dual-focus Fluorescence Correlation Spectroscopy (2fFCS)
- Stimulated Emission Depletion Microscopy (STED)
- Single Molecule Detection
- Time-resolved Fluorescence
- Fluorescence Anisotropy (Polarization)
- Pattern Matching Analysis
- Two-Photon Excitation (TPE)
- Diffuse Optical Tomography and Imaging
- Singlet Oxygen
- Laser Cutting/Ablation
- Materials Science
- Metrology
- Quantum Optics
-
Life Science
Life Science
Fluorescence Lifetime Correlation Spectroscopy (FLCS)
Correlation analysis of fluorescence intensity fluctuations weighted by fluorescence lifetimes
The fusion of Time-Correlated Single Photon Counting and Fluorescence Correlation Spectroscopy, called Fluorescence Lifetime Correlation Spectroscopy (FLCS), is a method that uses picosecond time-resolved fluorescence detection for separating different FCS-contributions.
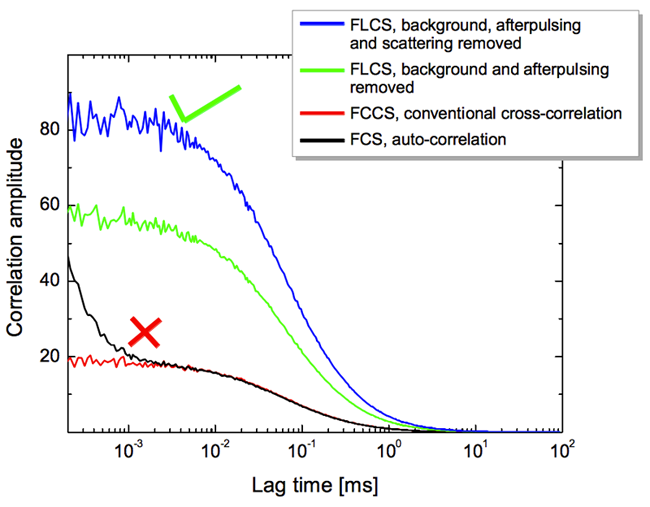
FLCS is of particular advantage when using spectrally inseperable fluorophores that differ in their lifetime for Fluorescence Cross-Correlation Spectroscopy (FCCS) because it offers elimination of spectral cross talk and background. It also offers a way around detector afterpulsing artifacts.
In FLCS, a separate autocorrelation function is calculated for each fluorophore component determined by its decay pattern, emitted, for example, by various species in the sample. The only assumption is that various emissions have different TCSPC histograms (i.e., different fluorescence lifetimes), which is practically always the case. The core of the method is a statistical separation of different intensity contributions with similar lifetimes, performed on a single photon level.
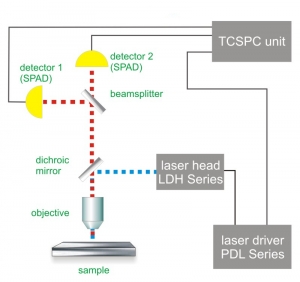 Similar to Fluorescence Correlation Spectroscopy (FCS) a highly sensitive confocal microscope is the prerequisite for FLCS experiments. Because FLCS builds on the additional information purveyed by the fluorescence decay characteristics, Time-Correlated Single Photon Counting (TCSPC) and its corresponding requirements is necessary for FLCS experiments.
Consequently the essential components of a FLCS set-up are:
- pulsed laser source(s)
- single photon sensitive detector(s)
- dichroic mirror (to separate fluorescence signal from excitation light)
- water objective with high NA to reduce abberation and increase quantum yield
- TCSPC unit to measure the time between excitation and fluorescence emission
- FCS acquisition and analysis software
Related technical and application notes:
- Application note: Fluorescence Lifetime Correlation Spectroscopy (FLCS)
- Application note: Time-gated Fluorescence Correlation Spectoscopy
- Application note:Quantitative Fluorescence Correlation Spectroscopy
- Technical note: Time-Correlated Single Photon Counting (TCSPC)
Presentations (as PDF files)
The following PicoQuant systems provide access to FLCS experiments
Single Photon Counting Confocal Microscope
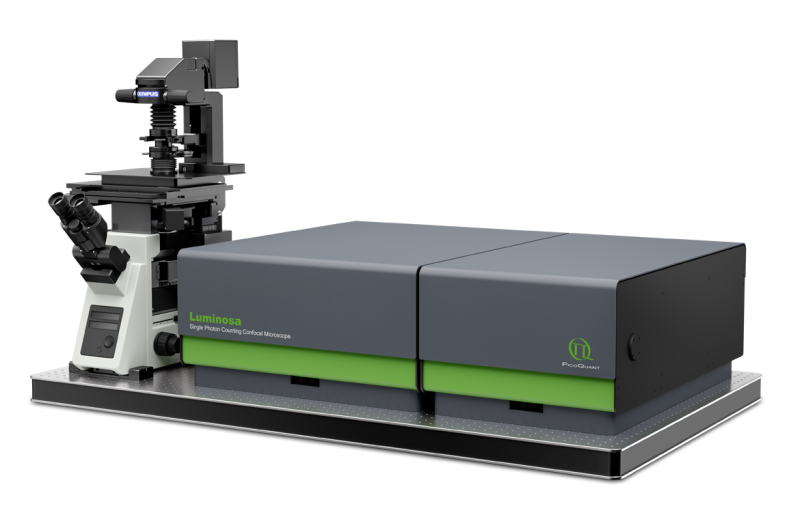
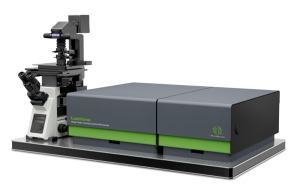
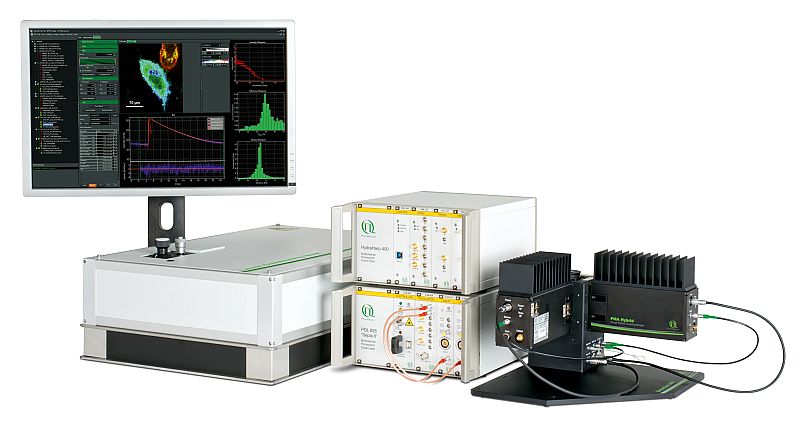
Luminosa combines state-of-the-art hardware with cutting edge software to deliver highest quality data while simplifying daily operation. The software includes context-based workflows for FLIM, FRET, and FCS, which allow the users to focus on their samples. Tight integration of hardware and software enable automated routines, e.g., for auto-alignment or laser power calibration, which increase ease of use as well as reproducibility of experiments. Still, an open mode of operation is available for full access to every optomechanical component via software.
Modular, time-resolved confocal fluorescence microscopy platform
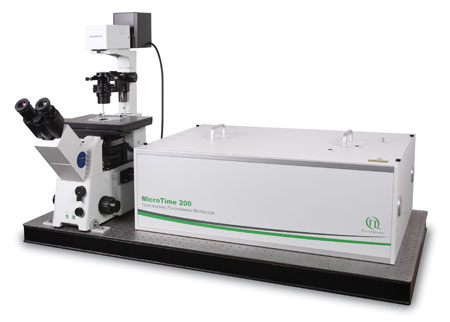
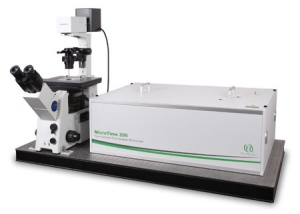
The MicroTime 200 time-resolved fluorescence microscope system is a powerful instrument capable of Fluorecence Corelation Spectroscopy and its daughter techniques as well as Fluorescence Lifetime Imaging (FLIM) with single molecule detection sensitivity. It contains the complete optics and electronics for recording virtually all aspects of the fluorescence dynamics of microscopic samples or femtoliter volumes. The instrument gains its exceptional sensitivity and flexibility in combination with unprecedented ease-of-use from a unique fusion of miniaturized and highly sophisticated state-of-the-art technologies. Although, these technologies enable to run an instrument of comparable complexity and power without having to spend more time on instrument maintenance than on original scientific content, the MicroTime200 remains an open platform that allows the advanced scientist to easily built upon the open character of the instrument in order to realize highly customized applications
LSM Upgrade Kits from PicoQuant add time-resolved capabilities to laser scanning microscopes from many major manufactures
Confocal Laser Scanning Microscopes (LSMs) are widely used tools in cell and molecular biology, biochemistry and other related sciences. PicoQuant's LSM Upgrade Kits greatly enhance the capabilities of these microscopes by extension to time-resolved techniques, and thereby providing not only Fluorescence Lifetime Imaging (FLIM) but also Fluorescence Correlation Spectroscopy (FCS) and a wealth of other time resolved techniques. The LSM Upgrade Kit combines PicoQuant products to a ready-to-use kit that fits your specific application on a state of the art Laser Scanning Microscope of your choice from Leica, Nikon, Olympus or Zeiss.
Upright time-resolved confocal microscope
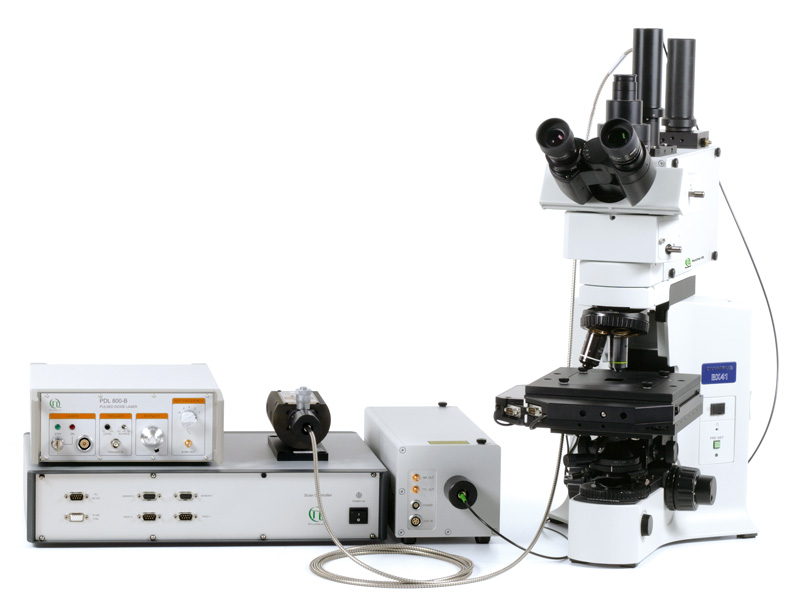
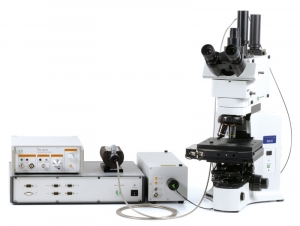
The upright time-resolved microscope MicroTime 100 contains the complete optics and electronics for recording F(C)CS or FLCS data as well as fluorescence decays in small volumes by means of Time-Correlated Single Photon Counting (TCSPC). The system is based on a conventional upright microscope body that permist easy access to a wide range of sample shapes and sizes.
 The following core components are needed to build a system capable of FLCS measurements, which are (partly) available from PicoQuant:
- Laser drivers
- Laser or LED heads
- Photon Counting Detector
- TCSPC and MCS Electronics
- Analysis software
- Confocal optics
Performing quasi-multichannel FCS measurements with only a single detector
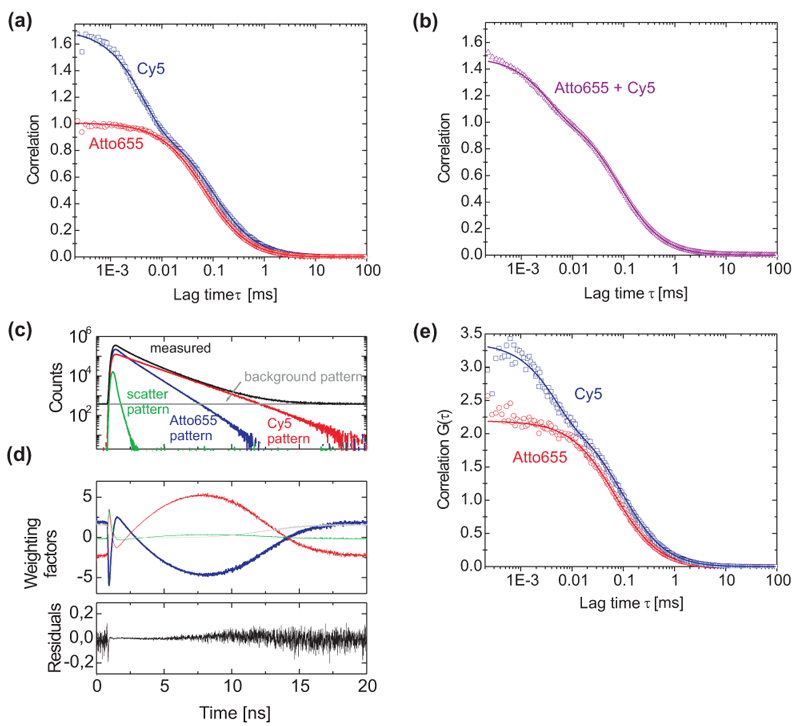 FLCS can be used as quasi-multichannel detection scheme even if only one laser wavelength and one detector is used. This can be understood as a lifetime analogy of a multicolor FCS measurement, with several inherent advantages.
It separates the autocorrelation curves (ACF) not by discriminating spectrally but based on their fluorescence decay characteristics. FLCS separates different signal components (e.g. emitters) quantitatively, because it uses all photons. It is possible to separate even several contributions, provided that their decay patterns are sufficiently different. In general, no assumptions on the functional form of the decay patterns are involved.
Owing to the separation principle based on TCSPC decay behaviour, distinct ACFs of two compounds can be obtained even if they have equal diffusion times. FLCS works equally well for emitters with completely overlapping fluorescence spectra.
No assumptions are made on the resulting ACFs. One can continue the analysis with the usual fitting of standard FCS models.
Once the intensity contributions are separated, even cross-correlation is straightforward. Note that the signal containing the various contributions is recorded by a single detector, hence the separately calculated ACFs correspond to the same detection volume, which can be interpreted as two (or more) perfectly overlapped excitation/detection volumes.
Here, as a proof of principle experiment the individual autocorrelation curves of a 50:50 mixture of Atto655 and Cy5 are retrieved from a single detector measurement. In total four different components contribute to the signal:
- Fluorescence from Cy5
- Fluorescence from Atto655
- Scattering of the excitation light
- Afterpulsing, dark counts, residual room light
The TCSPC decays of all four contributions are recorded in a control experiment. Fig. (a) displays the correlation curves and their respective fits of the pure Cy5 and ATTO-655 stock solutions. They are used to extract the filter curves necessary to separately calculate the individual FCS curves of the four contributions to the signal of the mixture measurement (only the fluorescence contributions are shown here).Fig. (b) shows the correlation curve of a 1:1 mixture of the two stock solutions of Cy5 and ATTO-655 together with a fit of a single component diffusion model including a triplet term. Note that this model, although false, is able to reproduce the correlation curve of the mixture. The decay curve decomposition and FLCS filters for a 1:1 Cy5 and ATTO-655 mixture is shown in Fig. (c) containing scaled patterns of the four signal components (ATTO-655: red, Cy5: blue, light scattering: green, background plus afterpulsing: grey) and the TCSPC histogram of the measurement (black). The scaling factors of the normalized patterns represent their respective contributions to the measured TCSPC curve (black line): 48.5% Cy5, 48.5% ATTO-655, 0.8% Scattering, 2.2% background and afterpulsing. Filter curves for these signal components are displayed in (d). The residuals indicate that the four chosen patterns are able to reconstruct the measured histogram of (c). By using the filter curves depicted in (d), FLCS is able to separate correlation curves of the same mixture (Fig. f). Apart from the doubled correlation amplitudes due to the halved specific concentrations FLCS yields almost identical correlation curves as for the pure stock solutions shown in (a).
Set-up:
- MicroTime 200
- Excitation: 640 nm
- Detection: 655 nm -725nm
- Analysis: SymPhoTime
Courtesy: S. Rüttinger, Physikalisch-Technische Bundesanstalt Berlin, Germany
Reference: Rüttinger et al., Journal of Fluorescence, Vol.20, p.0105-0114 (2010)
Leveraging fluorescence lifetime information for improved cross correlation spectroscopy (FCCS)
Fluorescence Cross Correlation (FCCS) is a commonly used technique to investigate binding and colocalization. Classically the two molecules under investigation are labelled using two dyes with different excitation and emission characteristics. Dual color excitation is used to simulatiousely excite both labels which are then separated onto two detection channels thanks to their different emission wavelength.
This widely used method however has two major disadvantages. Unavoidable spectral crosstalk feigns a cross-correlation even if there is none and secondly since the observation volume depends on the wavelength of excitation and emission wavelength the respective volumes of the two labels will always be different. Both effects make careful calibration and control experiments necessary.
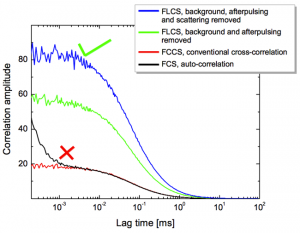
Instead of separating the two labels by color, Fluorescence Lifetime Cross Correlation (FLCCS) leverages the fluorescence lifetime information inherently available when the experiment is performed with TCSPC. This means that as long as the fluorescence lifetimes of the two labels are different they can be distinguished during the calculation of auto and cross-correlation curves. Consequently, only one detector is necessary to perform cross-correlation experiments.
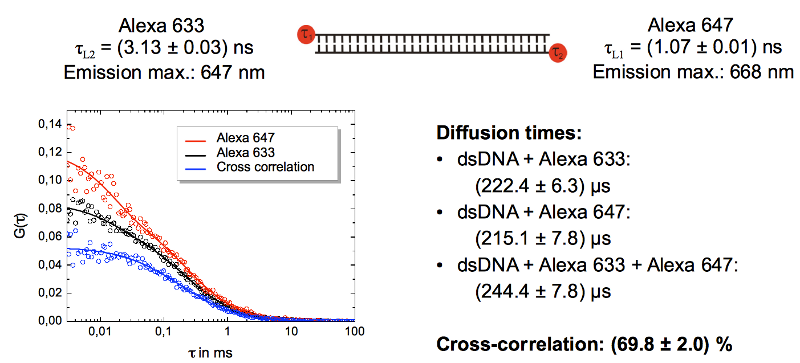
This is shown in the cross-correlation experiment using double stranded DNA oligonucleotide labeled with Alexa 633 and Alexa 647. Both dyes are spectrally unresolvable. Only one detector was used to acquire the correlation curves of Alexa 647 (red curve) and Alexa 633 (blue curve). A cross-correlation of almost 70% was calculated.
FLCS can of course also be used with labels that have different spectral characteristics either to eliminate cross-talk or to increase the number of labels.
Set-up:
- LSM Upgrade Kit
- Excitation: 635 nm
- Emission: 650 nm -720nm
- Analysis: SymPhoTime
Courtesy: M. Gärtner, P. Schwille, TU Dresden, Germany
Latest 10 publications related to FLCS
The following list is an extract of 10 recent publications from our bibliography that either bear reference or are releated to this application and our products in some way. Do you miss your publication? If yes, we will be happy to include it in our bibliography. Please send an e-mail to info@picoquant.com containing the appropriate citation. Thank you very much in advance for your kind co-operation.

 Contact us
 Luminosa
 MicroTime 200
 LSM Upgrade Kit
 MicroTime 100